. Delete all files from %installlocation%\Symantec\Symantec Endpoint
Protection Manager\data\outbox\ImportPackage folder. (without stopping
any services)
2. Delete everything older than today's date in
%installlocation%\Symantec\Symantec Endpoint Protection
Manager\Inetpub\content (also without stopping any services)
3. In the Symantec Admin Console go to Admin > Servers >
localhost. Right-click localhost and truncate the transaction logs.
Symantec has released new version of Symantec Endpoint Protection.
English versions of Symantec Endpoint Protection 12.1.5337.5000 (RU5) is
now available.
It has new content storage optimization feature:
As part of the upgrade to SEPM 12.1 RU5, the SEPM converts all of the
content from full definitions to delta definitions. This process is
resource intensive and may take an extended period of time. After this
process is completed, the SEPM will use significantly less disk space.
In a typical enterprise setup where 30 content revisions stored, the
SEPM upgrade process must reduce 55GB of full content to under 2GB of
delta content. This process requires significant resources to complete
and is impacted by the performance of any available CPUs, CPU cores
(physical/logical/hyperthreading), memory, and disks (I/O). On a server
that performs multiple roles, stores larger numbers of content, or is
otherwise resource constrained, this process may take a longer duration
to complete.
Refer this article to find more info: The LiveUpdate content
optimization and content storage space optimization steps take a long
time to complete when upgrading to Symantec Endpoint Protection Manager
12.1 RU5
http://www.symantec.com/docs/TECH224055
Monday, March 30, 2015
Thursday, March 12, 2015
vCenter Server Appliance: Troubleshooting full database partition
A customer of mine had within 6 months
twice a full database partition on a VMware vCenter Server
Appliance. After the first outage, the customer increased the size of
the partition which is mounted to /storage/db. Some months later, some
days ago, the vCSA became unresponsive again. Again because of a filled
up database partition. The customer increased the size of the database
partition again (~ 200 GB!!) and today I had time to take a look at
this nasty vCSA.
The situation

Within 2 days, the storage usage of the databse increased from 75% to 77%. First, I checked the size of the database:
|
1
2
3
4
5
6
7
8
9
10
11
12
13
14
|
vcsa:/opt/vmware/vpostgres/current/bin # /opt/vmware/vpostgres/current/bin/psql -h localhost -U vc VCDB
psql.bin (9.0.17)
Type "help" for help.
VCDB=> SELECT pg_database.datname, pg_size_pretty(pg_database_size(pg_database.datname)) AS size FROM pg_database;
datname | size
-----------+---------
template1 | 5353 kB
template0 | 5345 kB
postgres | 5449 kB
VCDB | 2007 MB
(4 rows)
VCDB=>
|
As you can see, the database had only 2 GB. The pg_log directory was more interesting:
|
1
2
3
4
5
6
7
8
9
10
11
12
13
14
15
16
17
18
19
20
|
vcsa:/storage/db/vpostgres # du -shc /storage/db/vpostgres/*
4.0K /storage/db/vpostgres/PG_VERSION
2.0G /storage/db/vpostgres/base
704K /storage/db/vpostgres/global
47M /storage/db/vpostgres/pg_clog
4.0K /storage/db/vpostgres/pg_hba.conf
4.0K /storage/db/vpostgres/pg_ident.conf
<strong>141G /storage/db/vpostgres/pg_log</strong>
252K /storage/db/vpostgres/pg_multixact
12K /storage/db/vpostgres/pg_notify
324K /storage/db/vpostgres/pg_stat_tmp
20K /storage/db/vpostgres/pg_subtrans
4.0K /storage/db/vpostgres/pg_tblspc
4.0K /storage/db/vpostgres/pg_twophase
81M /storage/db/vpostgres/pg_xlog
20K /storage/db/vpostgres/postgresql.conf
4.0K /storage/db/vpostgres/postmaster.opts
4.0K /storage/db/vpostgres/postmaster.pid
0 /storage/db/vpostgres/serverlog
143G total
|
The directory was full with log files. The log files containted only one message:
|
1
2
|
vcsa:/storage/db/vpostgres/pg_log # more postgresql-2015-03-04_090525.log
123462 tm:2015-03-04 09:05:25.488 UTC db:VCDB pid:1527 WARNING: there is already a transaction in progress
|
The solution
This led me to VMware KB2092127
(After upgrading to vCenter Server Appliance 5.5 Update 2, pg_log file
reports this error: WARNING: there is already a transaction in
progress). And yes, this appliance was upgraded to U2 with high
probability. The solution is described in KB2092127, and is really easy
to implement. Please note that this is only a workaround. There’s
currently no solution, as mentioned in the article.
How to connect/interact with VCVA DB (DB2 and vPostgres)
If
you need to connect/interact with the VC appliance database, for
example to remove the locks of DB2 or performing an script, you can do
the following after being logged in as root via SSH on the appliance:
- On VCVA 5.0 GA with DB2:
1. Turn into the db2inst user:
vcenter:/ # su db2inst1
2. Start the db2 client:
db2inst1@vcenter:/> db2
You'll see a prompt like this:
db2 =>
3. connect to the VCDB database:
db2 => connect to VCDB
(the command is like this, very literal)
4. Change to VC schema:
db2 => set schema vc
5. Perform any command you need. For example, to remove the VPX_SESSIONLOCK lines, you can do like this:
db2 => delete from VPX_SESSIONLOCK
DB20000I The SQL command completed successfully.
You can type "quit" anytime you want to exit from the db2 client, and "exit" when you want to go back to root userspace.
- On VCVA with vPostgres:
1. Connect to the database using psql:
vcenter:/ # /opt/vmware/vpostgres/1.0/bin/psql -U vc -d VCDB
You'll see a prompt like this:
psql (9.0.4)
Type "help" for help.
VCDB=>
2. Perform any command you need (selects, inserts, etc). For example, to list all tables:
VCDB=> \dt
There are a lot of new tables in 5.1, (mainly the vpx_hist_stat* ones).
To quit, just type "\q"
DB20000I The SQL command completed successfully.
Type "help" for help.
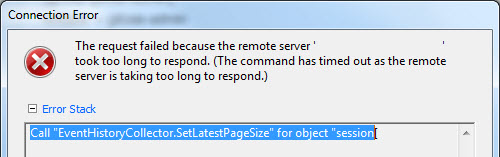
vCenter Appliance – Call “EventHistoryCollector.SetLatestPageSize” for object “SessionID” on vCenter Server failed.
When using the vSphere Client to connect to the
VMware vCenter Server Appliance was appearing every now and again.
Call “EventHistoryCollector.SetLatestPageSize” for object “SessionID” on vCenter Server “ServerName” failed. (unfortunately didnt take a screenshot, so here’s one I found and modified).
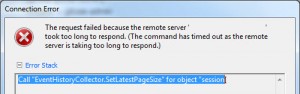
This issue is pretty common, and is to do with the amount of events in the database not being purged, and is covered by VMware in this KB article for windows environments.
However not so commonly covered for the vCenter Appliance which uses a progress database.
After a bit of digging around, I found the following crude solution on the VMware communities board.
So open up a console to your VCSA, login in. Run the following commands
Here are the steps:
References:
https://communities.vmware.com/thread/80738
http://www.educationalcentre.co.uk/vmware-5-1-vcenter-appliance-call-eventhistorycollector-setlatestpagesize-for-object-sessionid-on-vcenter-server-failed/#more-418
http://kb.vmware.com/selfservice/microsites/search.do?language=en_US&cmd=displayKC&externalId=2054085
http://kb.vmware.com/selfservice/microsites/search.do?language=en_US&cmd=displayKC&externalId=2056968
Call “EventHistoryCollector.SetLatestPageSize” for object “SessionID” on vCenter Server “ServerName” failed. (unfortunately didnt take a screenshot, so here’s one I found and modified).
This issue is pretty common, and is to do with the amount of events in the database not being purged, and is covered by VMware in this KB article for windows environments.
However not so commonly covered for the vCenter Appliance which uses a progress database.
After a bit of digging around, I found the following crude solution on the VMware communities board.
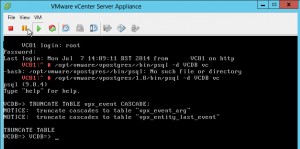
So open up a console to your VCSA, login in. Run the following commands
/opt/vmware/vpostgres/1.0/bin/psql -d VCDB vc
TRUNCATE TABLE vpx_event CASCADE;
then to exit “/q”
Here are the steps:
- First of all - stop VPXD
- service vmware-vxpd stop
- connect to DB:
/opt/vmware/vpostgres/1.0/bin/psql -d VCDB vc
You will be prompted for the "vc" password which is not the same as the
root password.
Password is in "/etc/vmware-vpx/embedded_db.cfg" file
- issue this commands:
- TRUNCATE TABLE vpx_event CASCADE;
- TRUNCATE TABLE vpx_event_arg CASCADE;
- TRUNCATE TABLE vpx_task CASCADE;
- quit DB command line
- issue the command "/q "
- start the VPXD
- service vmware-vxpd start or restart vCSA appliance
- Check the size of VCBD. Now the size is only 165MB
- VCDB=> SELECT pg_database.datname, pg_size_pretty(pg_database_size(pg_database.datname)) AS size FROM pg_database;
- datname | size
- -----------+---------
template1 | 5289 kB
template0 | 5281 kB
postgres | 5385 kB
VCDB | 165 MB
(4 rows)
References:
https://communities.vmware.com/thread/80738
http://www.educationalcentre.co.uk/vmware-5-1-vcenter-appliance-call-eventhistorycollector-setlatestpagesize-for-object-sessionid-on-vcenter-server-failed/#more-418
http://kb.vmware.com/selfservice/microsites/search.do?language=en_US&cmd=displayKC&externalId=2054085
http://kb.vmware.com/selfservice/microsites/search.do?language=en_US&cmd=displayKC&externalId=2056968
VMware vCenter Server Appliance Error: VPXD must be stopped to perform this operation.
http://www.virtualizationteam.com/management-automation/vmware-vcenter-server-appliance-error-vpxd-must-be-stopped-to-perform-this-operation.html
Error: VPXD must be stopped to perform this operation.
This error has came up while trying to change authentication to active directory authentication and kinda seen the same error when trying to change the database to an external database. For some reason the Server service stop button is shadowed as well which mean I could not stop it by the GUI interface. Although my lab setup is not ideal and it might just due to the way I set it up, though I will still document how I resolved this where the same mechanism can be used to stop and restart any other service used by the vCenter Server Appliance. Below are the steps I have followed:
1- SSH to your VMware vCenter Server Appliance using the root account.
2- Execute the following command to see the status of all the service running in the vCenter Appliance: chkconfig
The output of all services will look something like below:
localhost:~ # chkconfig
after.local off
apache2 off
arpd off
atftpd off
auditd on
autoyast off
chargen off
chargen-udp off
cron on
daytime off
daytime-udp off
dbus on
dcerpcd on
dhcp6r off
dhcp6s off
dhcpd off
discard off
discard-udp off
earlysyslog on
echo off
echo-udp off
eventlogd on
fbset on
gpm off
haldaemon on
haveged on
irq_balancer on
kbd on
ldap on
lsassd off
lwiod on
mdadmd off
multipathd off
netlogond on
netstat off
network on
network-remotefs on
nfs on
ntp off
pcscd off
powerd off
random on
raw off
rpasswdd off
rpcbind on
rpmconfigcheck off
sendmail on
servers off
services off
setserial off
skeleton.compat off
splash on
splash_early on
sshd 235
stunnel off
syslog on
syslog-collector off
systat off
time off
time-udp off
uuidd off
vami-lighttp 235
vami-sfcb 235
vaos 235
vmware-inventoryservice on
vmware-logbrowser off
vmware-netdumper off
vmware-rbd-watchdog off
vmware-tools on
vmware-vpostgres on
vmware-vpxd on
vsphere-client on
xinetd off
ypbind off
3- Stop the required service in my case was vmware-vpxd using the following command: chkconfig service-name off (ex: chkconfig vmware-vpxd off)
4- carry out your changes
5- Start the service again using the following command: chkconfig service-name on (ex: chkconfig vmware-vpxd on)
Interpreting an ESX/ESXi host purple diagnostic screen
Interpreting an ESX/ESXi host purple diagnostic screen (1004250)
Purpose
An ESX/ESXi purple screen error appears similar to:

Note: This article uses the information in this purple screen as an example.
Resolution
What is the VMkernel?
The VMkernel is the operating system core of ESX/ESXi. The kernel handles resource scheduling and device IO. Device IO is handled by the VMware network and storage stacks, which serve as a layer between the virtual file system, network devices and the device drivers that control physical devices.Interpreting the purple diagnostic screen
If the VMkernel experiences an error, the error displays in a purple diagnostic screen. The purple diagnostic screen looks similar to:VMware ESX Server [Releasebuild-98103
PCPU 1 locked up. Failed to ack TLB invalidate.
frame=0x3a37d98 ip=0x625e94 cr2=0x0 cr3=0x40c66000 cr4=0x16c
es=0xffffffff ds=0xffffffff fs=0xffffffff gs=0xffffffff
eax=0xffffffff ebx=0xffffffff ecx=0xffffffff edx=0xffffffff
ebp=0x3a37ef4 esi=0xffffffff edi=0xffffffff err=-1 eflags=0xffffffff
*0:1037/helper1-4 1:1107/vmm0:Fagi 2:1121/vmware-vm 3:1122/mks:Franc
0x3a37ef4:[0x625e94]Panic+0x17 stack: 0x833ab4, 0x3a37f10, 0x3a37f48
0x3a37f04:[0x625e94]Panic+0x17 stack: 0x833ab4, 0x1, 0x14a03a0
0x3a37f48:[0x64bfa4]TLBDoInvalidate+0x38f stack: 0x3a37f54, 0x40, 0x2
0x3a37f70:[0x66da4d]XMapForceFlush+0x64 stack: 0x0, 0x4d3a, 0x0
0x3a37fac:[0x652b8b]helpFunc+0x2d2 stack: 0x1, 0x14a4580, 0x0
0x3a37ffc:[0x750902]CpuSched_StartWorld+0x109 stack: 0x0, 0x0, 0x0
0x3a38000:[0x0]blk_dev+0xfd76461f stack: 0x0, 0x0, 0x0
VMK uptime: 7:05:43:45.014 TSC: 1751259712918392
Starting coredump to disk Starting coredump to disk Dumping using slot 1 of 1...using slot 1 of 1... log
Here is a breakdown of each section of the above purple diagnostic screen:
- The Product and Build:
VMware ESX Server [Releasebuild-98103]
This section of the purple diagnostic screen identifies the product and build that has experienced the error. In this example, the product is VMware ESX Server build 98103.
- The Error Message:
PCPU 1 locked up. Failed to ack TLB invalidate
This section of the purple diagnostic screen identifies the error message that has been reported. There are only a finite number of error messages that can be reported. These error messages are discussed later in this article.
- The CPU Registers:
frame=0x3a37d98 ip=0x625e94 cr2=0x0 cr3=0x40c66000 cr4=0x16c
es=0xffffffff ds=0xffffffff fs=0xffffffff gs=0xffffffff
eax=0xffffffff ebx=0xffffffff ecx=0xffffffff edx=0xffffffff
ebp=0x3a37ef4 esi=0xffffffff edi=0xffffffff err=-1 eflags=0xffffffff
These are the values that were in the physical CPU registers at the time of the error. The information in these registers may vary greatly between VMkernel errors. These registers can only be used internally when debugging a core dump of the VMkernel error. For more information about these registers, see http://www.intel.com/products/processor/manuals/ for Intel and http://support.amd.com/us/psearch/Pages/psearch.aspx for AMD. At the AMD site, search for the Architecture Programmer's manual for your specific processor type.
Note: The preceding links were correct as of March 28, 2013. If you find the links to be broken, provide feedback on the article and a VMware employee will update the article as necessary.
- The Physical CPU:
*0:1037/helper1-4 1:1107/vmm0:Fagi 2:1121/vmware-vm 3:1122/mks:Franc
This section of the purple diagnostic screen identifies the physical CPU that was running instructions during the VMkernel error. In the example, the * beside the 0 indicates that physical CPU 0 was running an operation at the time of the failure. In newer versions of ESX, instead of including an *, the preceding letters CPU are included. For example, if the same error as the above were to occur in newer versions of VMware ESX, the same line appears as:CPU0:1037/helper1-4 cpu1:1107/vmm0:Fagi cpu2:1121/vmware-vm cpu3:1122/mks:Franc.
This section of the purple diagnostic screen also describes the world (process) that was running on the CPU at the time of the error. In the above example, the userworld running was helper1-4.
Note: The name of the process may be truncated.
- The Stack Trace:
0x3a37ef4:[0x625e94]Panic+0x17 stack: 0x833ab4, 0x3a37f10, 0x3a37f48
0x3a37f04:[0x625e94]Panic+0x17 stack: 0x833ab4, 0x1, 0x14a03a0
0x3a37f48:[0x64bfa4]TLBDoInvalidate+0x38f stack: 0x3a37f54, 0x40, 0x2
0x3a37f70:[0x66da4d]XMapForceFlush+0x64 stack: 0x0, 0x4d3a, 0x0
0x3a37fac:[0x652b8b]helpFunc+0x2d2 stack: 0x1, 0x14a4580, 0x0
0x3a37ffc:[0x750902]CpuSched_StartWorld+0x109 stack: 0x0, 0x0, 0x0
0x3a38000:[0x0]blk_dev+0xfd76461f stack: 0x0, 0x0, 0x0
The stack represents what the VMkernel was doing at the time of the error. In this example, it was trying to clear memory page tables (TLB). This information is a vital tool in the diagnosis of purple screen errors by evaluating the actions of the kernel at the time of the error.
- The Uptime:
VMK uptime: 7:05:43:45.014 TSC: 1751259712918392
This section indicates how long a server had been running since the last boot. In this example, the ESX host was running for 7 days, 5 hours, 43 minutes and 45.014 seconds. The TSC value is the number of CPU clock cycles that have elapsed since the server was started.
- The Core Dump:
Starting coredump to disk Starting coredump to disk Dumping using slot 1 of 1...using slot 1 of 1... log
This section of the purple diagnostic screen indicates that the contents of the VMkernel memory are being copied to the vmkcore partition.
Using the error message of the purple diagnostic screen to troubleshoot a vmkernel error
The VMkernel error message generated by the purple screen can be used to identify the cause of the issue. The number of error messages that can be produced are finite. This is a list of known VMkernel error messages.- Type: Console Oops
Example Error:COS Error: Oops
Description: An ESX host can fail and cause a purple screen when there is a Service Console oops. Unlike most purple screen errors, it is not triggered by the VMkernel. Instead the error is triggered by the Service Console and occurs at the Linux level. These purple screen errors contain additional information from the Linux kernel. For more information about Console Oops, see Understanding an "Oops" purple diagnostic screen (1006802).
- Type: Lost Heartbeat
Example Error:Lost Heartbeat
Description: The ESX VMkernel and the Service Console Linux kernel run at the same time on ESX. The Service Console Linux kernel runs a process called vmnixhbd, which heartbeats the VMkernel as long as it is able to allocate and free a page of memory. If no heartbeats are received before a timeout period of 30 minutes, the VMkernel triggers a COS Panic and a purple diagnostics screen that mentions a Lost Heartbeat. For more information on Lost Heatbeats, see Understanding a "Lost Heartbeat" purple diagnostic screen (1009525) .
- Type: Assert
Example Error:ASSERT bora/vmkernel/main/pframe_int.h:527
Description: Assert errors are software errors, because they are related to assumptions on which the program is based. This type of purple screen error is primarily caused by software issues. For more information on the assert error message, see Understanding ASSERT and NOT_IMPLEMENTED purple diagnostic screens (1019956).
- Type: Not Implemented
Example Error:NOT_IMPLEMENTED /build/mts/release/bora-84374/bora/vmkernel/main/util.c:83
Description: A not implemented error message occurs when the code encounters a situation that it was not designed to handle. For more information, see Understanding ASSERT and NOT_IMPLEMENTED purple diagnostic screens (1019956).
- Type: Spin count exceeded / Possible deadlock
Example Error:Spin count exceeded (iplLock) - possible deadlock
Description: A VMware ESX host may report a Spin count exceeded and possible deadlock in a purple diagnostic screen when a thread is attempting to execute in the critical section of code. Since it was trying to enter the critical section, the thread needed to poll a mutex for a lock prior to executing the code by conducting a spinlock operation. The thread continues to poll the mutex during the spinlock operation, but there is a certain limit of how many times it polls the mutex. For more information on Spin count exceeded errors, see Understanding a "Spin count exceeded" purple diagnostic screen (1020105).
- Type: Failed to ack TLB invalidate
Example Error:PCPU 1 locked up. Failed to ack TLB invalidate.
Description: Physical CPUs fail when trying to clear memory page tables. For more information, see Understanding a Failed to ack TLB invalidate purple diagnostic screen (1020214).
- Type: Exception 13 (General Protection Fault)
Example Error:#GP Exception(13) in world 4130:helper13-0 @ 0x41803399e303
Description: A general protection fault (Exception 13) occurs under one of the following circumstances: the page being requested does not belong to the program requesting it (and not mapped in program memory), or the program does not have rights to perform a read or write operation on the page. For more information on Exception 13 or Page Fault, see Understanding Exception 13 and Exception 14 purple diagnostic screen events (1020181).
- Type: Exception 14 (Page Fault)
Example Error: #PF Exception type 14 in world 136:helper0-0 @ 0x4a8e6e
Description: A page fault (Exception 14) occurs when the page being requested has not been successfully loaded into memory. For more information on Exception 14 or Page Fault, see Understanding Exception 13 and Exception 14 purple diagnostic screen events (1020181).
- Type: Exception 18 (Machine Check Exception)
Example Error: Machine Check Exception: Unable to continue
Example Error: Hardware (Machine) Error
Description: A Machine Check Exception (MCE) is generated by the hardware and reported by the host. Consult your hardware vendor in the event of an MCE. By evaluating the information presented, it is possible to identify the individual component reporting the error. For more information on MCE, see Decoding Machine Check Exception (MCE) output after a purple screen error (1005184).
Using the pattern analysis to troubleshoot multiple vmkernel errors on the same ESX host
In the event that you experience multiple purple diagnostic screens from the same VMware ESX host, you can use the sample of multiple purple diagnostic screens to determine the likeliness of an issue being related to hardware or software. This can be done by identifying patterns in these sections of the purple diagnostic screen:- The error message and the stack trace:
- If the error message and stack vary greatly between vmkernel errors, this indicates that software is not always hitting the same error. Although inconclusive, this may indicate a hardware issue.
- If the error message and the stack are always identical between vmkernel errors, this indicates that software is always hitting the same error. Although inconclusive, this may indicate a software issue.
- For more information about the error message you are experiencing, refer to the above section about the specific error message.
- The physical CPU:
- If the physical CPU value remains the same across multiple vmkernel errors, this indicates that the software is always failing on the same physical CPU. Although inconclusive, this may indicate a CPU issue.
- For more information, see Determining if virtual machine and ESX host unresponsiveness is caused by hardware issues (1003560).
- The world:
- If the world value remains the same across multiple VMkernel errors, this indicates that the vmkernel is failing when receiving instructions from the same world. Although inconclusive, this may indicate a world is sending instructions that may be triggering the VMkernel error.
Subscribe to:
Posts (Atom)